This Content Is Only For Subscribers
In the business of real estate investing, guessing is expensive. When a landlord sets a rental price based on what they “feel” a property is worth, or simply tacks on a flat $50 increase to last year’s lease, they are gambling with their Net Operating Income (NOI). In a dynamic, high-velocity market like a Texas summer, that gamble almost always results in left money on the table or crippling vacancy.
The transition from a casual landlord to a serious investor requires replacing intuition with data. Setting the optimal rent is a mathematical exercise, not an emotional one. Here is how to use market data to price your assets with precision.
The Flaw in “Zestimate” Pricing
The most common data error landlords make is relying on consumer-facing aggregate tools—like Zillow’s “Zestimate” or rent range algorithms—as their primary pricing mechanism.
These algorithms are blunt instruments. They pull data from a broad geographic radius and average it out. They do not know that your property is zoned for the highly desirable elementary school, while the house three streets over is not. They do not account for the fact that your property has a newly installed HVAC system and a fenced yard, while the “comparable” property has window units and a shared driveway.
Consumer algorithms provide a baseline starting point, but they are entirely insufficient for an investor looking to maximize yield. If you rely solely on these tools, you will inherently price your property at the median, ensuring average returns.
Building a True Comparable Analysis
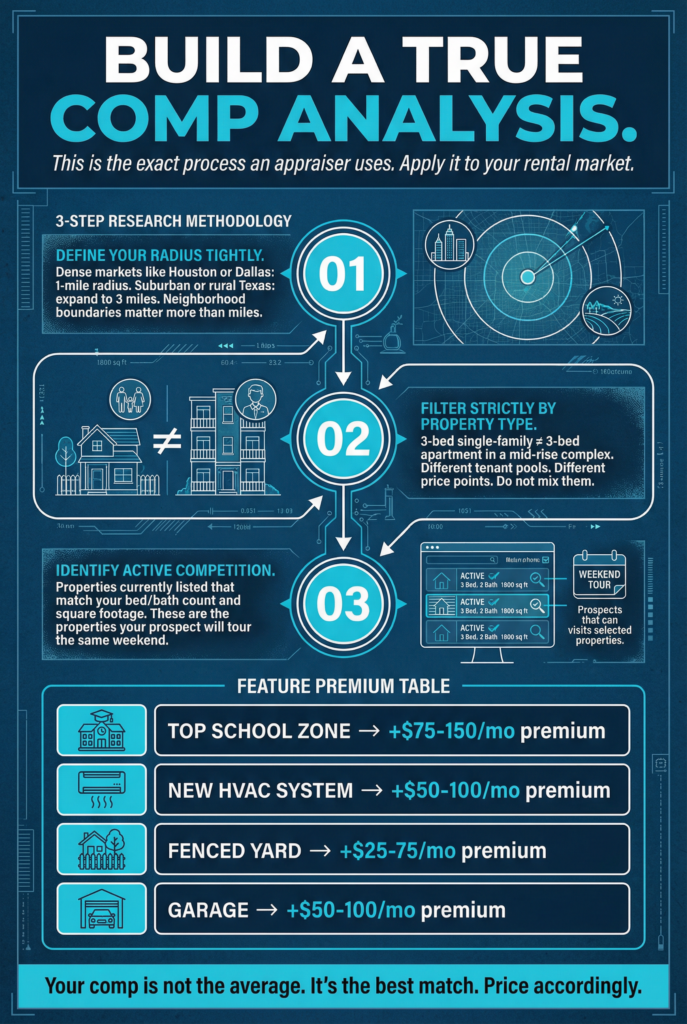
To set the optimal rent, you must build a hyper-local, feature-specific comparable analysis (often called a “rent comp”). This is the exact same process an appraiser uses to value a property for a sale, applied to the rental market.
First, define your radius tightly. In a dense market like Houston or Dallas, a comparable property should be within a one-mile radius. In suburban or rural Texas markets, you may need to expand to three miles.
Second, filter strictly by property type. A three-bedroom single-family home is not comparable to a three-bedroom apartment in a mid-rise complex with a community pool. The tenant pools for these two assets are entirely different.
Third, identify the active competition. Look at properties currently listed for rent that match your bed/bath count and square footage. These are the properties your prospective tenant will tour on the same day they tour yours. If your property is superior in condition or location, your price should reflect that premium.
Analyzing the “Days on Market” Metric
The single most important data point in your comparable analysis is not the asking price; it is the “Days on Market” (DOM) metric.
If you find three comparable properties in your neighborhood listed at $2,400 a month, but they have all been sitting vacant for 45 days during the peak summer season, $2,400 is not the market rent. It is the ceiling that the market has firmly rejected.
Conversely, if comparable properties are being listed at $2,200 and disappearing from the market in 48 hours, that price is too low. The market is clearing the inventory faster than it can be replenished, indicating a severe supply-demand imbalance. As an investor, this is your signal to push the price higher.
The Power of Historical Portfolio Data

External market data is crucial, but the most accurate data you possess is your own historical portfolio performance.
If you own multiple properties, track the velocity of your own turnovers. If your three-bedroom units in a specific zip code consistently lease within three days of listing every June, you are underpricing them. Your internal data is telling you that demand for your specific product outstrips your pricing model.
Track your inquiry-to-application ratio. If you list a property and receive thirty inquiries but only one application, your price might be right, but your marketing or property condition is flawed. If you receive three inquiries and three applications, your price is too low.
Setting optimal rent is a continuous feedback loop. You analyze the external comparables, test the market with a strategic price, and then use the immediate data (inquiries, showings, applications) to validate or adjust that number. By anchoring your pricing strategy in hard data rather than gut feeling, you ensure that your asset is always performing at its maximum mathematical potential.